Introduction
Soil classification is like a language between engineers .Soil classification for engineering purposes should be based mainly on the mechanical properties, permeability & strength.
The Unified Soil Classification System (USCS) , the American Association of State Highway and Transportation Officials (AASHTO) and Indian soil classification system are the common classification system in the present scenario in civil engineering practice. Here we will discuss pertaining to soil classification in the following order.
1.Classification System
2. Symbolization System
3.Finding Out Cc & Cv
4.Finding Out Clay & Silt From A Line
5.Coarse Grain Soil Classification System
6.Fine Grain Soil Classification System
7. Example
1. Classification System:
The aim of a classification system is to differentiate between different soils. The system must be simple.Classifying soils into groups with similar behavior can provide geotechnical engineers a general guidance,
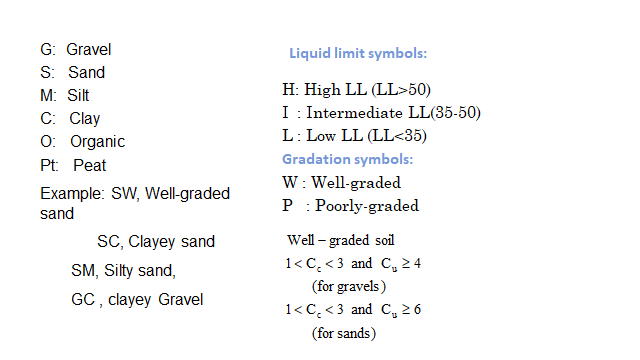
2. Symbolization System
Symbols and other soil properties used for soil classification which are beneficial are given below :
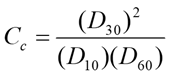
3.Finding Out Cc & Cv
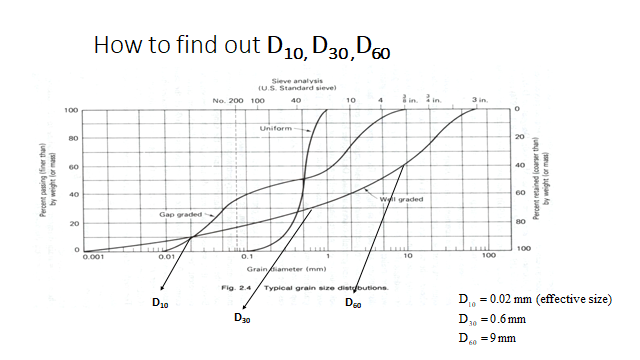
What is D10 , D30 & D60 ?
Practical Definition Of D10: The size of the sieve from which 10 % material are passing. (10% finer than size size)
Practical Definition Of D30: The size of the sieve from which 30 % material are passing. (30% finer than size) •
Practical Definition Of D60: The size of the sieve from which 60 % material are passing. (60% finer than size)
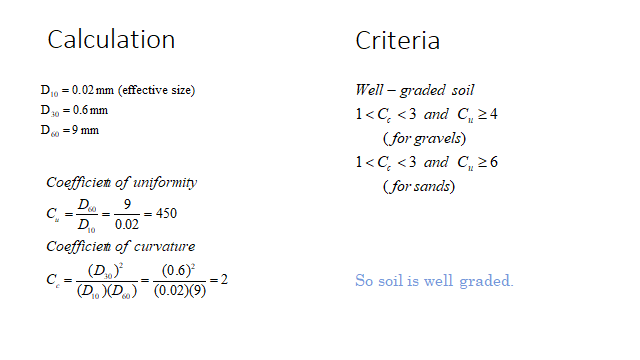
Coefficient Of Curvature
Coefficient Of Uniformity
Both Cuand Cc will be 1 for a single-sized soil.
If Cu > 5 means a well-graded soil means a soil which having particles over a wide size range.
If Cc between 1 and 3 it indicates a well-graded soil.
If Cu < 3 it indicates a uniform soil
3.1.Border line (Dual Symbol)
For the below given conditions, a dual symbol will be used.
1.For Coarse-grained soils with PI between 5% – 12% and LL between about 10 and 30). –For Sand it is denoted as SW-SM and for gravel it is denoted as GW-GM.
2.For Fine-grained soils with limits within the shaded zone. (PI between 4 and 7 and LL between 10 and 30 and more clay type materials. CL-ML means Silty clay
3.2 Organic soil
Organic soils -A sample having decay vegetable tissue in various stages of decomposition and looks like a dark-brown to black color, and smells like organic odor will be designated as organic soil and will be classified as peat, PT.
Organic clay or silt: -“If soil’s liquid limit (LL) after oven drying is less than 75 % of its liquid limit before drying.” it will be organic soil & the first symbol shall be O. -The second symbol can be obtained by locating the values of PI and LL (as usual not oven dried) in the plasticity chart
4.Finding Out Clay(C), Silt( M) & Organic Soil(O) From A Line
We need grain analysis table & 3 sieves are very important i.e 4.75 mm,75 micron and 425 micron(for LL & PL).
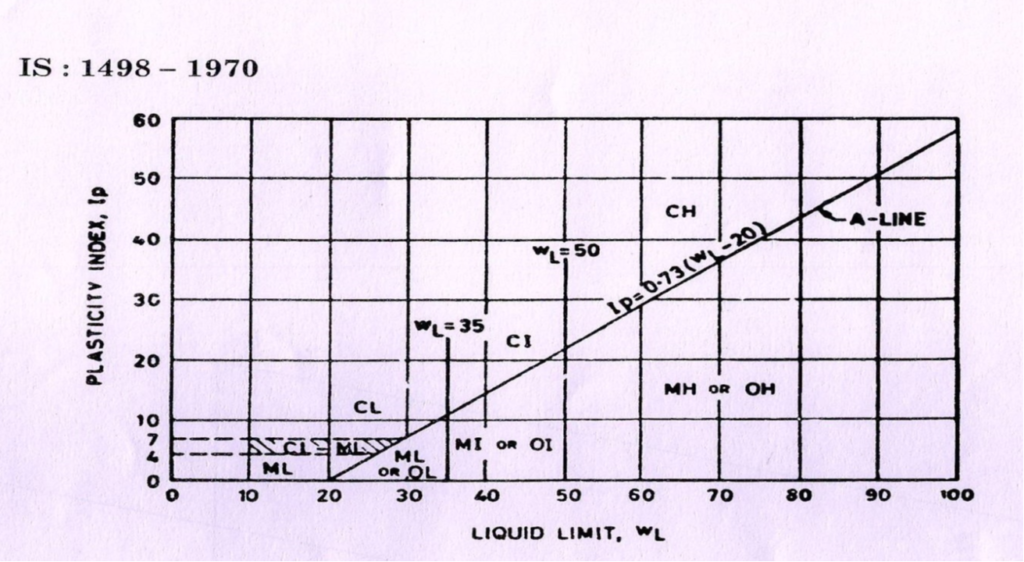
For determining A Line formula A line IP =.73(WL-20) ,The IP obtain from this will be compare from original IP.
Suppose Original IP given is 9.03% and WL is 25.86%.
Find out the A line , A line=.73(WL-20)=.73*5.86=4.28.
Compare it with original IP which is 9.03% which is greater than 4.28% So Sample comes above A line. Above A line will be denoted by C and below A line will be denoted by M or O.
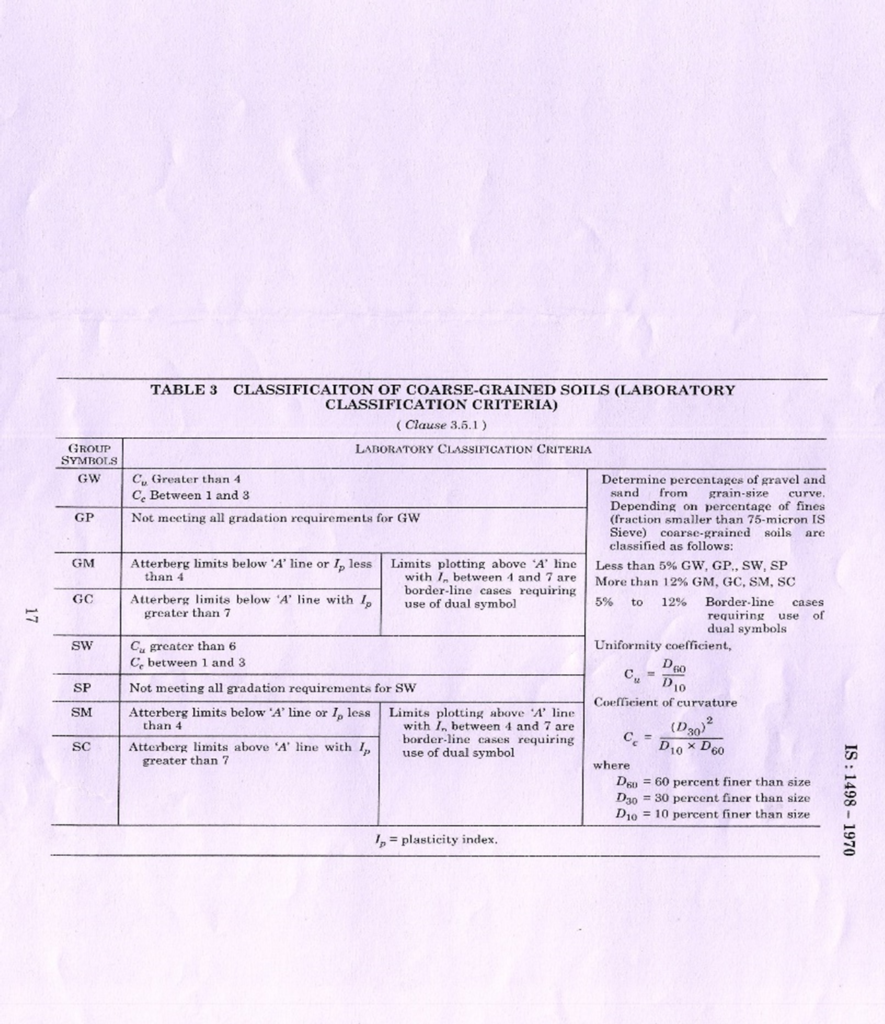
5. Coarse Soil Identification
If 50 % 0r less material is passing from 0.075 mm soil it will be treated as coarse soil & they can be further divided into either gravels (G) or sands (S).According to gradation, they are further symbolized as well-graded (W) or poorly graded (P). If fine soils are present, they can be grouped as silt fines (M) or clay fines (C).

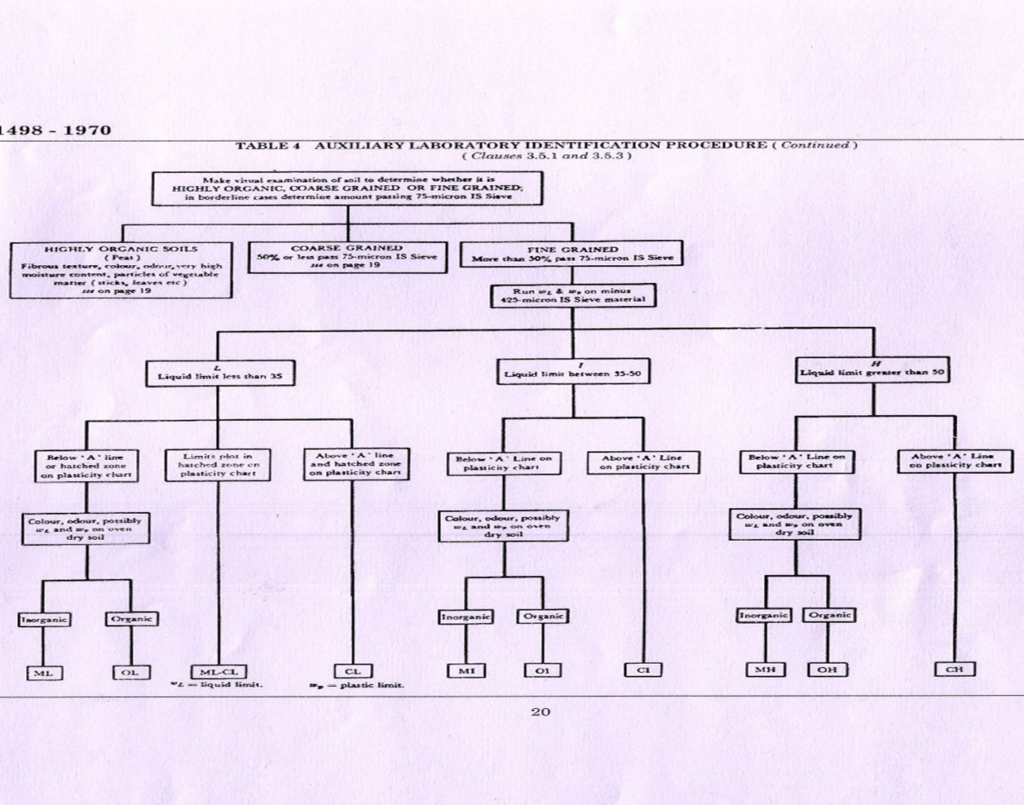
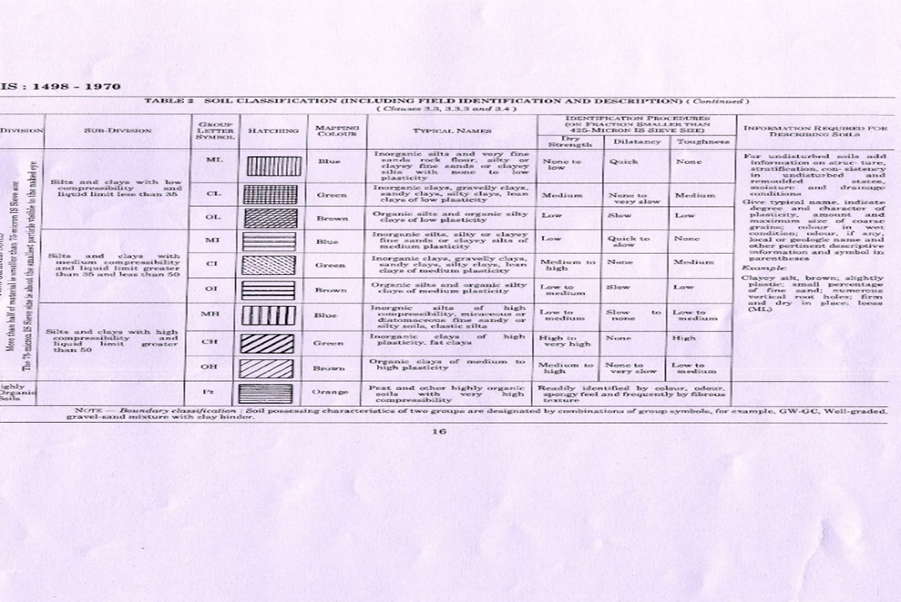
6. Fine Grain Soil Classification
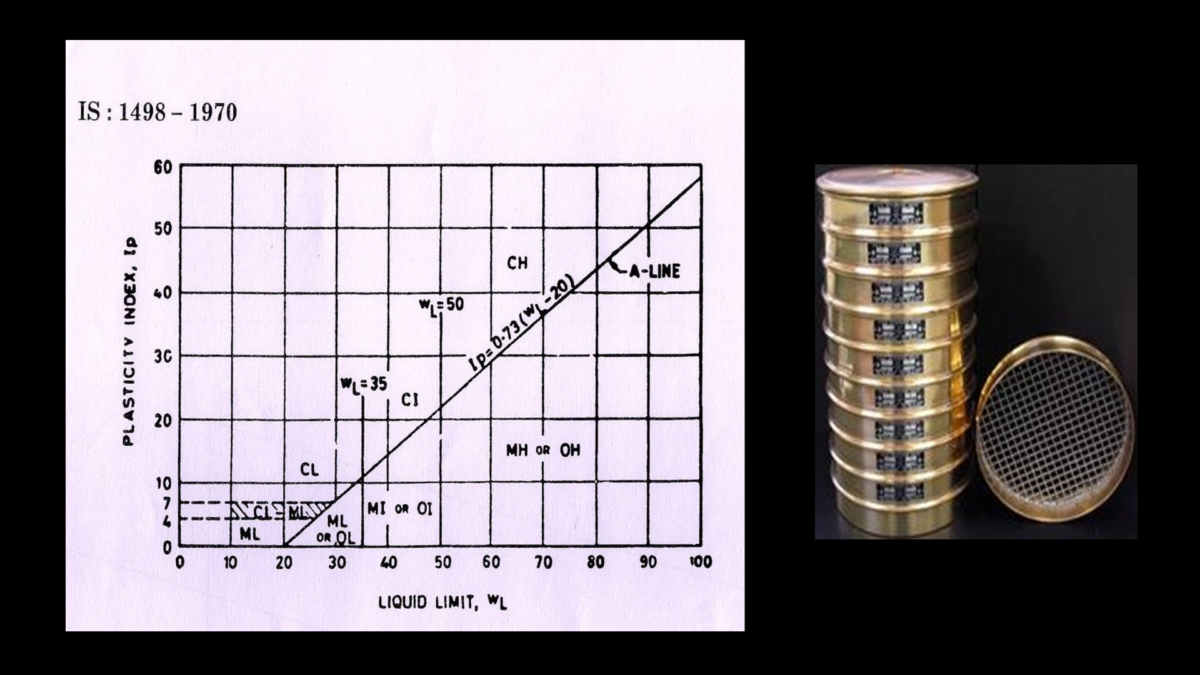
Fine-grained soils are those which passes more than 50% of the material from IS sieve 0.075 mm. A plasticity chart , based on the values of liquid limit (WL) and plasticity index (IP), is provided in IS 1498 to aid classification. The ‘A’ line in this chart has been given by as IP = 0.73 (WL – 20).Any soil which is above A line ; will always be denoted as Clay(C). In the same manner , if soil is below A line ; will be denoted as Silt(M) as discussed earlier in para 4.
Now depending on the point in the chart, fine soils are divided into clays (C), silts (M), or organic soils (O).Three divisions of plasticity are also defined as follows.
If Liquid Limit of the soil is less than 35% ; soil will be classified as CL/ML/OL.If Liquid Limit of the soil is in between 35% & 50% soil will be classified as CI/MI/OI.In the same manner if Liquid Limit of the soil is more than 50% soil will be classified as CH/MH/OH.
| Low plasticity means liquid Limit is less than 35 |
WL< 35% |
| Intermediate plasticity means liquid Limit is between 35 % & 50 % |
35% < WL< 50% |
| High plasticity means liquid Limit is more than 50% |
WL> 50% |
Example 1
1.Percentage passing from sieve 4.75mm=38.66%
2.Percentage passing from sieve 0.425mm=37.47%
3 .Percentage passing from sieve 0.075mm=33.47%
4.Liquid Limit =16.80%
5.Plastic Index =.16%
Classify the soil
ANSWER: Less % passing from .075mm sieve so it is coarse grain soil. Less % passing from 4.75mm sieve, hence it is GRAVEL. Its A line=.73*-3.2=-2.336 Sample comes above A line and at .075mm sieve passing more than 12%; so it is classified as GC
Example 2
1.Percentage passing from sieve 4.75mm=68.12%
2.Percentage passing from sieve 0.425mm=56.23%
3 .Percentage passing from sieve 0.075mm=34.62%
4.Liquid Limit =24.5%
5.Plastic Index =N.P Classify the soil
ANSWER: Less % passing from .075mm sieve so it is coarse grain soil. higher % passing from 4.75mm sieve, hence it is SAND. Its A line=.73*4.5=3.285 Sample comes below A line and at .075mm sieve passing more than 12%; so it is classified as SM
Example 3
1.Percentage passing from sieve 4.75mm=99.96%
2.Percentage passing from sieve 0.425mm=97%
3 .Percentage passing from sieve 0.075mm=74.91%
4.Liquid Limit =25.86%
5.Plastic Index =9.03%
Classify the soil
ANSWER:
More % passing from .075mm sieve so it is fine grain soil. Liquid Limit is less than 35% so it is low plastic. Its A line=.73(WL-20)=.73*5.86=4.28.Sample comes above A line so it is classified as CL
Example 4
1.Percentage passing from sieve 4.75mm=99.80%
2.Percentage passing from sieve 0.425mm=99.55%
3 .Percentage passing from sieve 0.075mm=36.10%
4.Liquid Limit =17.54%
5.Plastic Index =N.P
Classify the soil ?
ANSWER:
Less % passing from .075mm sieve so it is coarse grain soil.its % passing from .075mm sieve is more than 12% .Its A line=.73(WL-220)=.73*-2.46= -1.80 Sample comes above A line so it is classified as SC. •
Example 5
1.Percentage passing from sieve 4.75mm=99.96%
2.Percentage passing from sieve 0.425mm=93.87%
3 .Percentage passing from sieve 0.075mm=58.99%
4.Liquid Limit =22%
5.Plastic Index =3.7%
Classify the soil
ANSWER:
More % passing from .075mm sieve so it is fine grain soil. Liquid Limit is less than 35% so it is low plastic.Its A line=.73(WL-20)=.73*2=1.46 Sample comes above A line so it is classified as CL
Example 6
1.Percentage passing from sieve 4.75mm=100%
2.Percentage passing from sieve 0.425mm=94.30%
3 .Percentage passing from sieve 0.075mm=51.54%
4.Liquid Limit =23.0%
5.Plastic Index =4.54%
Classify the soil
ANSWER:
More % passing from .075mm sieve so it is fine grain soil. Liquid Limit is
less than 35% but PI is 4.54 and it comes on hatched line so it is classified ML-CL
Example 7
1.Percentage passing from sieve 4.75mm=82.3%
2.Percentage passing from sieve 0.425mm=73.11%
3 .Percentage passing from sieve 0.075mm=4.82%
4.Liquid Limit =25.42%
5.Plastic Index =8.64%
6.Coefficient of Uniformity =6.66
7.Coefficient of curvature =1.35
Classify the soil
ANSWER: Less % passing from .075mm sieve so it is course grain soil. Greater% passing from 4.75 so it is SAND. Less than 5% passing from .075mm sieve and well graded so it is classified as SW
Example 8
1.Percentage passing from sieve 4.75mm=99.31%
2.Percentage passing from sieve 0.425mm=88.57%
3 .Percentage passing from sieve 0.075mm=50.38
4.Liquid Limit =21.50%
5.Plastic Index =4.84%
Classify the soil
ANSWER:
More % passing from .075mm sieve so it is fine grain soil. Liquid Limit is less than 35% but PI is 4.54 and it comes on hatched line so it is classified ML-CL