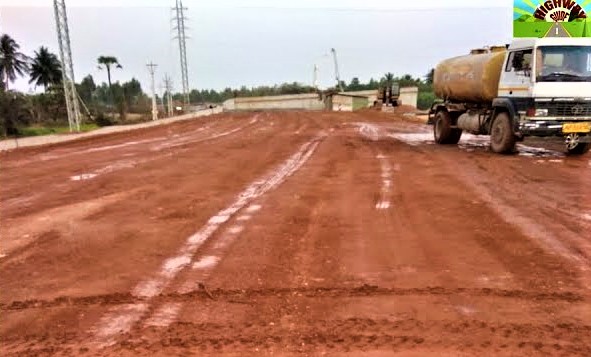
Soil compaction is a artificial method in which expulsion of air from soil is done by mechanical means thereby increasing the density of soil In construction.
It is important to know and control the soil density during compaction process .To determine the proper soil compaction of embankment or subgrade in highway project , several methods were developed.The most prominent method is Sand Replacement method to check the relative density at site.In this article ,we will discuss in detail “how to perform sand replacement test at site”.
STANDARD USED
IS: 2720 (Part 28) 1974.
OBJECTIVE
To determine the in place dry density of natural or compacted fine and medium grained soils by sand replacement method.
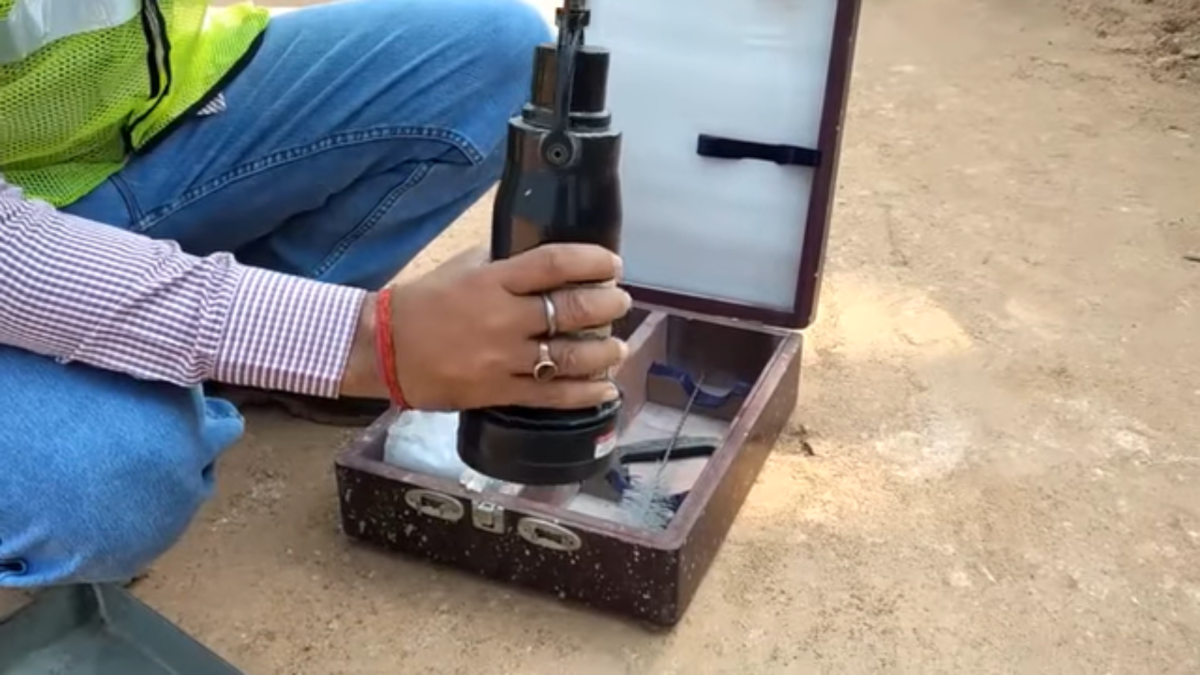
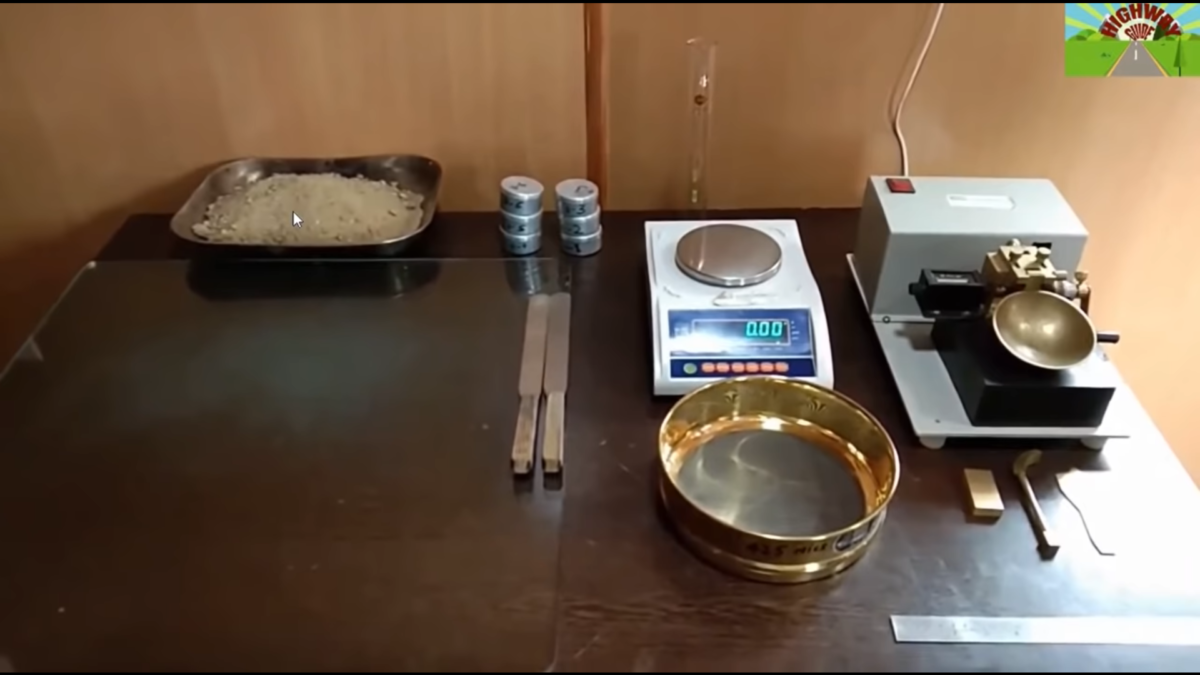
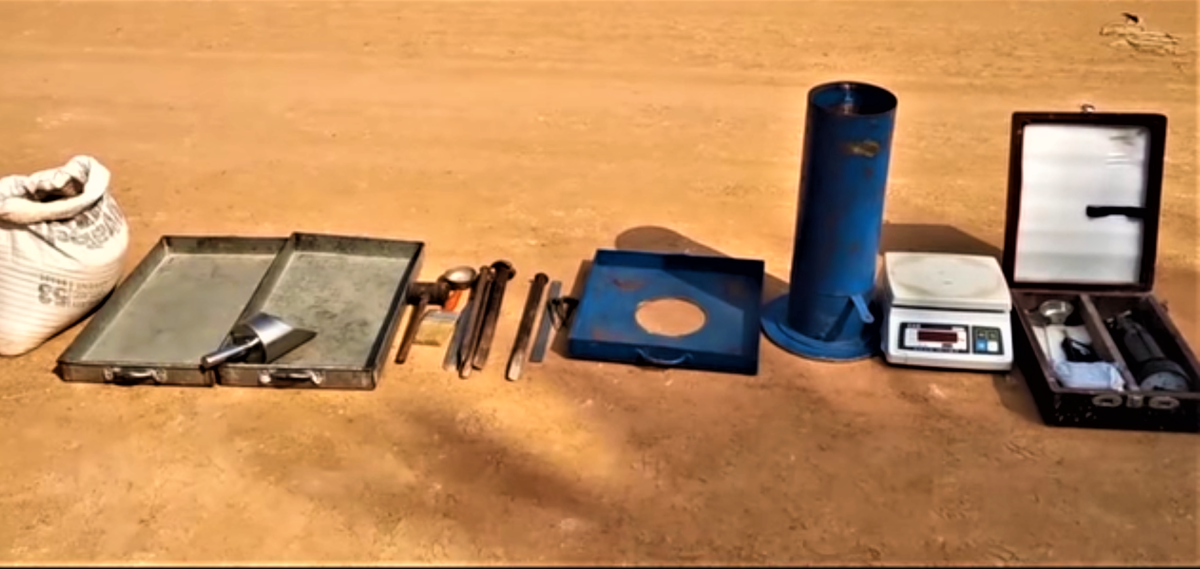
APPARATUS
- Small sand pouring cylinder for depth up to 150 mm.
- Large sand pouring cylinder for depth more than 150 mm and not exceeding 250 mm.
- Tools for excavating holes such as a scraper tool for leveling the surface, bent spoon or dibber for digging holes.
- Cylindrical calibrating container with material diameter of 100 mm and an internal depth of 150 mm.
- Balance of capacity 15 kg and sensitivity 1 gram.
- A glass plate o about 600 mm square area and atleast 10 mm or more thicker.
- Metal containers.
- Metal tray having area 300 mm square , 40 mm deep with a 100 mm hole in the center of the tray.
- 1 mm and 600 microns IS sieves..
- Clean, uniformly graded natural sand passing 1 mm sieve and retained on 600 microns sieve.
PROCEDURE
Calibration of Sand Pouring Cylinder
- Clean and dry, sand passing 1 mm sieve and retained on 600 microns sieve approximately 5 to 6 kg for small pouring cylinder and 23 to 24 kg of sand for large pouring cylinder.
- Remove the cap of the pouring cylinder.
- Weigh the empty pouring cylinder (W).
- Close the shutter of the cone.
- Fill the sand in to the pouring cylinder about 10 mm below from the top.
- Determine the net weight of sand in the cylinder (W1).
- Now place the pouring cylinder on a clean plane surface, open the shutter and allow the sand to flow in to the cone.
- Close the shutter when the flow stops.
- Carefully collect and weigh (W2) the sand discharged from the pouring cylinder.
- Refill the pouring cylinder with sand such that the initial weight is W1.
- Place the pouring cylinder on the top of the calibration cylinder concentrically.
- Open the shutter and allow the sand to flow in to the calibrating cylinder.
- Close the shutter when the flow stops or no further movement of sand takes place in the cylinder.
- Determine the weight (W3) of the pouring cylinder.
- Repeat the above procedure for at least three times and determine the mean values of W2 and W3.
- Determine the volume (V) of the calibrating cylinder either by measuring the dimensions
- (Diameter and height) or by filling with water until the brim.
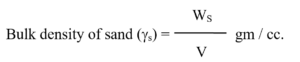
CALCULATIONS
Weight of sand (WS) in the calibration container up to level top
WS = W1 – W3 – W2 grams
Volume of calibrating container = V cc
DETERMINATION OF SOIL DENSITY
- Prepare a flat approximately 450 mm square area with the aid of a scraper tool.
- Place the metal tray just above the central hole on the prepared surface of the soil to be tested.
- Excavate the hole in the soil with a chisel & hammer using the hole in the tray as a pattern to the depth of the layer to be tested.
- Carefully collect the excavated soil from the hole and weigh (Ww).
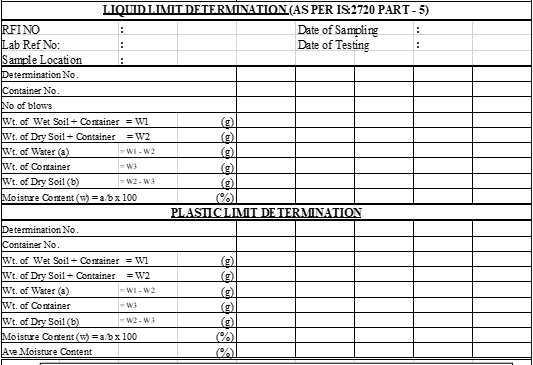
- Determine the water content (W) of the excavated soil as per IS: 2720 (Part 2) 1973.
- Fill the pouring cylinder to the constant weight (W1) i.e. weight equal to the initial weight during calibration.
- Remove the metal tray before the pouring cylinder is placed in position over the excavated hole.
- Place the cylinder such that the base of the cylinder covers the hole concentrically.
- Open the shutter and allow the sand to run out in to the hole.
- Close the shutter of the pouring cylinder when no further movement of sand takes place in the cylinder.
- Remove the cylinder and determine the net weight of sand (W4).
CALCULATIONS
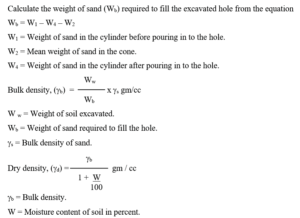
REPORT
- Report the bulk density and dry density of soil to the nearest second decimal.
PRECAUTIONS
- Care shall be taken to see that the test sand used is clean, dry and uniformly graded.
- Care shall be taken in excavating the hole to see that the hole is not enlarged against the side of the hole, as this will result in lower densities.
- Care shall be taken to see that the same initial weight of sand is taken during calibration and during density measurement in the field.